11 Amazon Seller Metrics that are Critical to Success in Ecommerce

Having to keep track of all those metrics on Seller Central to optimize your Amazon business can get overwhelming. Amazon also tends to roll out more sophisticated metrics as the marketplace gets more and more complex.
This article will tell you which metrics have the most impact on your ecommerce business and how you can stay on top of them.
Related Listening: E403: The Top 5 Success Factors for Selling on Amazon
Contents
Before we dive right into it, let’s categorize our metrics into two: Business Reports and Account Health.
Business Reports Metrics impact how profitable your business is. That includes sales and conversion rate, earnings, etc.
Account Health Metrics deal with how well your products and Amazon account is performing on the marketplace. Among these are Brand Health (if you’re in Brand Registry) and the Inventory Performance Index.

SKU-level Profitability
Product profitability largely depends on your landed cost, which is basically the total amount you pay for the entire process of sourcing your product, shipping, and fulfilling orders. You’ll want to monitor this metric month on month because the costs aren’t exactly static.
The costs include:
- FOB cost. This is what you pay your supplier for just the product itself
- Freight costs. This is the cost of having your product shipped from China (or wherever you are sourcing your product) to the US.
- 3PL charges. If you’re using a 3PL, this is what they will charge you for accepting and storing your inventory.
- Partnered Carrier fees. This is the cost you pay for shipping your inventory from your 3PL into the Amazon FBA warehouse.
- FBA costs. This is what Amazon will charge you for storing your inventory in FBA and fulfilling orders on your behalf.
Your SKU-level profitability is basically the difference between your selling price and the total of all those costs, which sadly not a lot of sellers take into consideration.
Staying on top of these costs can be a handful for sure, but there are some applications that let you input these costs to estimate your profitability and help in deciding how to price your product.
FBA Costs
As mentioned earlier, this is the cost that Amazon charges you for storing inventory and shipping them out to customers when you make a sale. We have an up-to-date FBA fees calculator where you can key in your data and see what your true cost is for selling on Amazon.
For that matter, your FBA fees will largely depend on your product’s weight and dimensions, and this can go wrong for a couple of reasons: either Amazon incorrectly measured your item, which can and does happen, or that your products are actually bigger than expected.
To keep tabs on your weight and dimensions, you can go to Manage FBA Inventory on Seller Central.
If you happen to notice that the weight and dimensions are higher than they should be, you can ask Amazon to change this by opening a case on Seller Central.
Advertising Costs
Advertising is part and parcel of doing ecommerce. In fact, soaring advertising costs are among the biggest threats to an Amazon business.
In a nutshell, what you want to look at is your TACoS, or Total Advertising Cost of Sale (some sellers also prefer True ACoS). This is the ratio of your total ad spend to the total sales under your account.
TACoS = Total Ad Spend/Total Sales
Determining your TACoS gives you a holistic view of ALL sales under your account. It takes into consideration your sales from PPC relative to the sales that you make organically.
Generally speaking, a low TACoS means that you have a healthy ratio of paid and organic sales and could have a good number of repeat customers. Conversely, a high TACoS could mean you need to revisit your strategy and which keywords you are bidding on.

While there is no hard and fast rule as to what a healthy TACoS should look like, we aim for somewhere around the 10% mark. But keep in mind that you want to rely heavily on paid ads when launching a new product, so a reasonable TACoS at that state might be somewhere around 25-30%.
You’ll also want to keep an eye on your TACoS trends. A flat or decreasing trend means that your product is generating steady sales and that your brand awareness is growing. On the other hand, an increasing TACoS over time could mean that you are spending more and more on advertising without any significant traction in organic sales.
To calculate your TACoS, go to Reports > Business Reports. You can download a report for a given time period and compare that to the results you see in the campaign manager. Or you can use third party tools like Helium 10.
Related Reading: Advanced Amazon PPC Advertising Strategies
NCX Rate
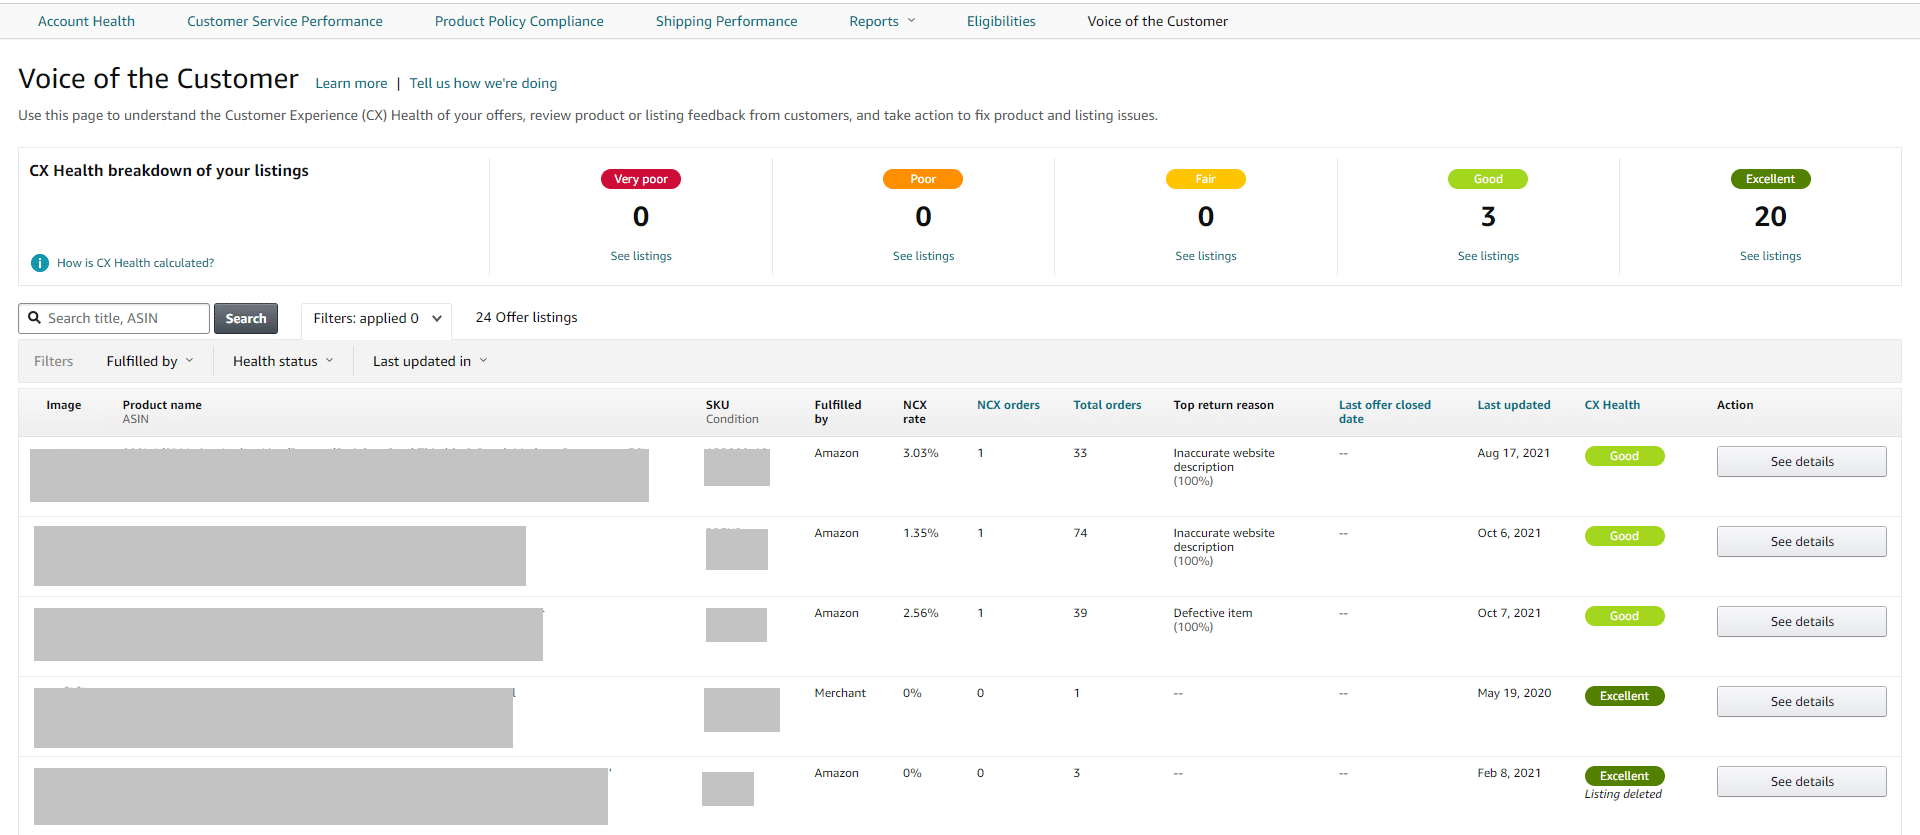
NCX (negative customer experience) has to do with returns, damages, and other customer complaints about your products. You can access it through Performance > Voice of the Customer.
The information you’ll see here will give you an idea what the most common complaints are, which products are most at risk, and if there are any actionable steps so you can maintain a healthy NCX rate.
Related to this is shrinkage, which basically refers to lost inventory and returned unsellable merchandise, say, when a customer buys your product and returns it broken.
Keeping track of these metrics are important because high NCX and return rates increase the likelihood of your items getting automatically delisted by Amazon’s algorithm, or even your Amazon account getting suspended altogether–not to mention the money you’d be losing if these figures are too high.
One thing about the return rate is that it tends to be category specific. For example, a 20% return rate is reasonable in the apparel or fashion categories, but we only ever saw up to 5% when we were running our brand for coloring books.
Another thing to keep in mind is that Amazon itself actually loses your stuff quite often and “forgets” to reimburse you for this. These cases can add up and you’d be surprised how much Amazon might actually owe you.
To check what’s going on with your inventory and start processing these reimbursements, go to Reports > Fulfillment > Inventory Adjustments.
Related Reading: The Ultimate Guide to Amazon Reimbursements
Account Health Metrics
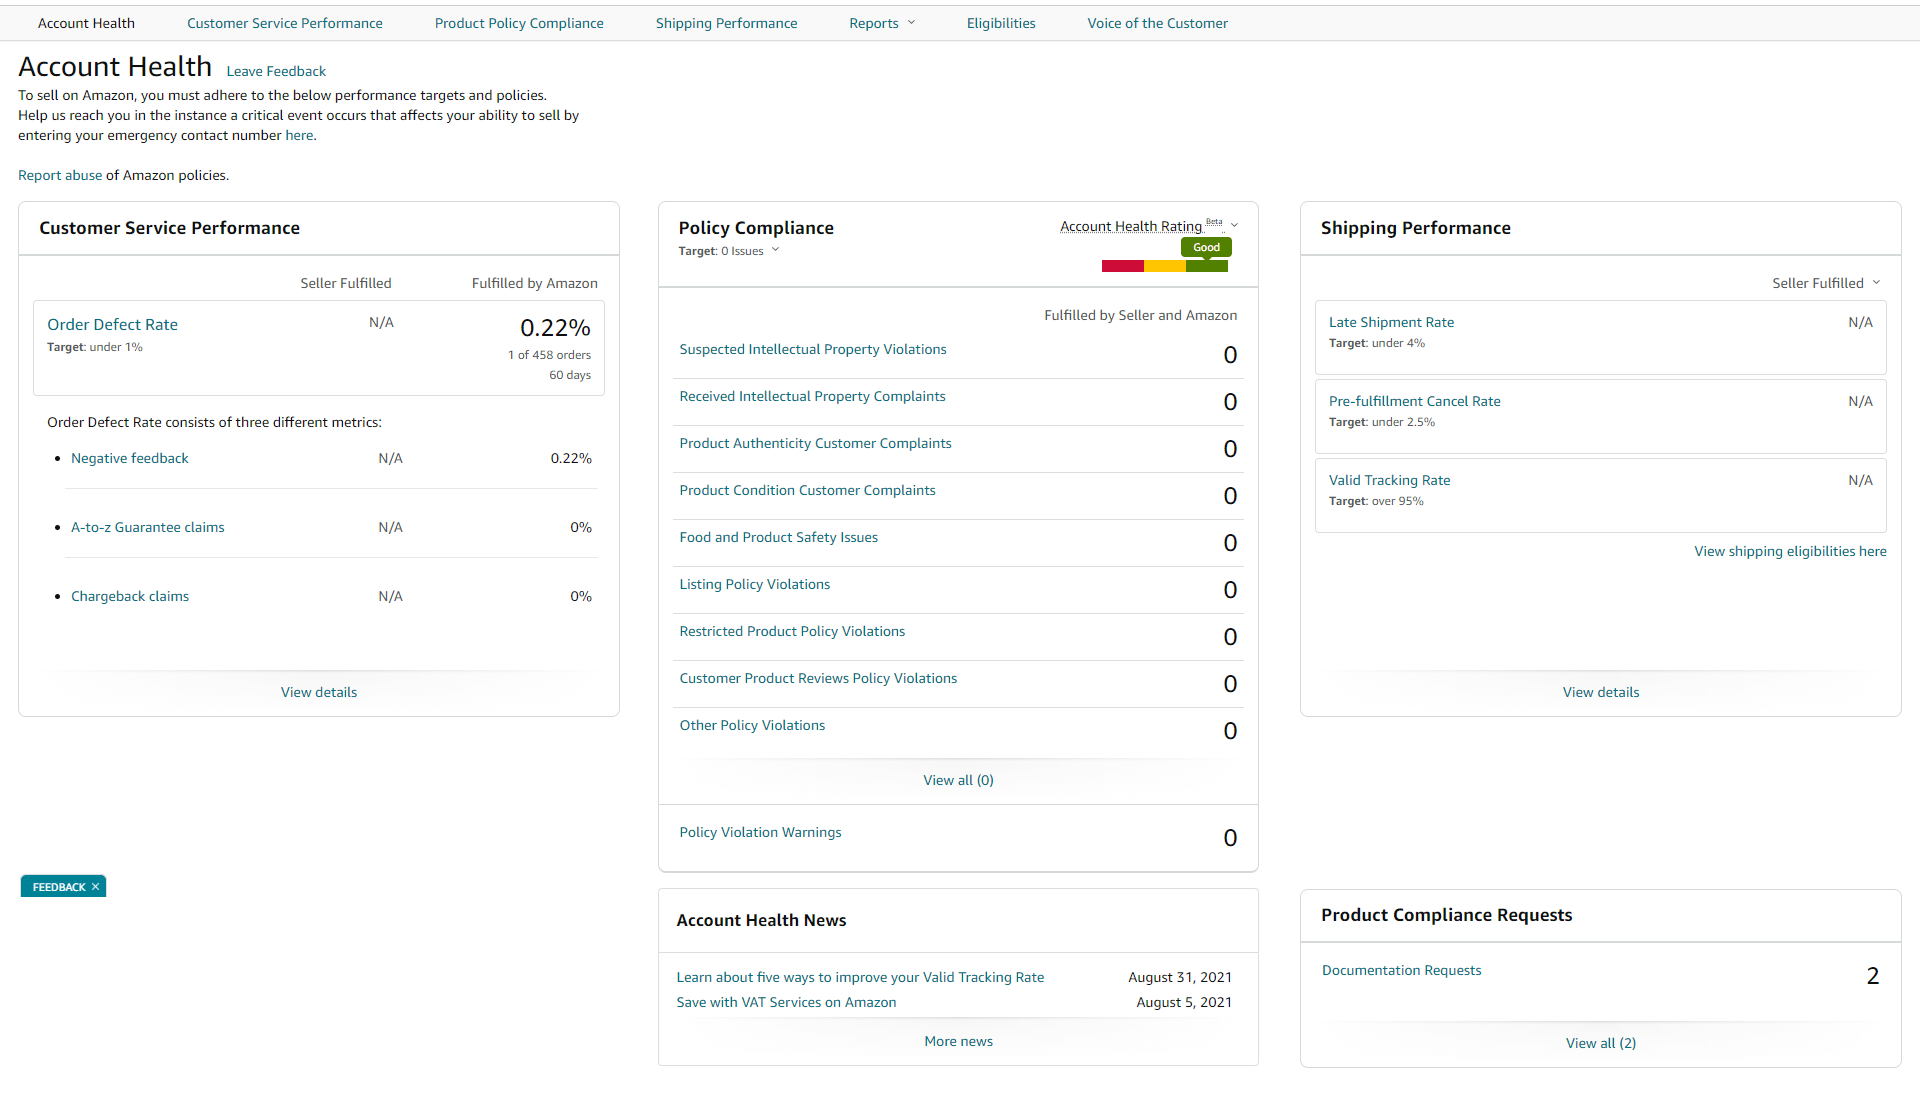
The other category of critical seller metrics are what we can call Account Health Metrics, or those that deal with the general performance of your seller account on Amazon. To see these stats, go to Performance > Account Health.
Needless to say, a healthy seller account will go a long way for your business. Conversely, poor account health could mean poor sales and even product or account suspension.
Order Defect Rate
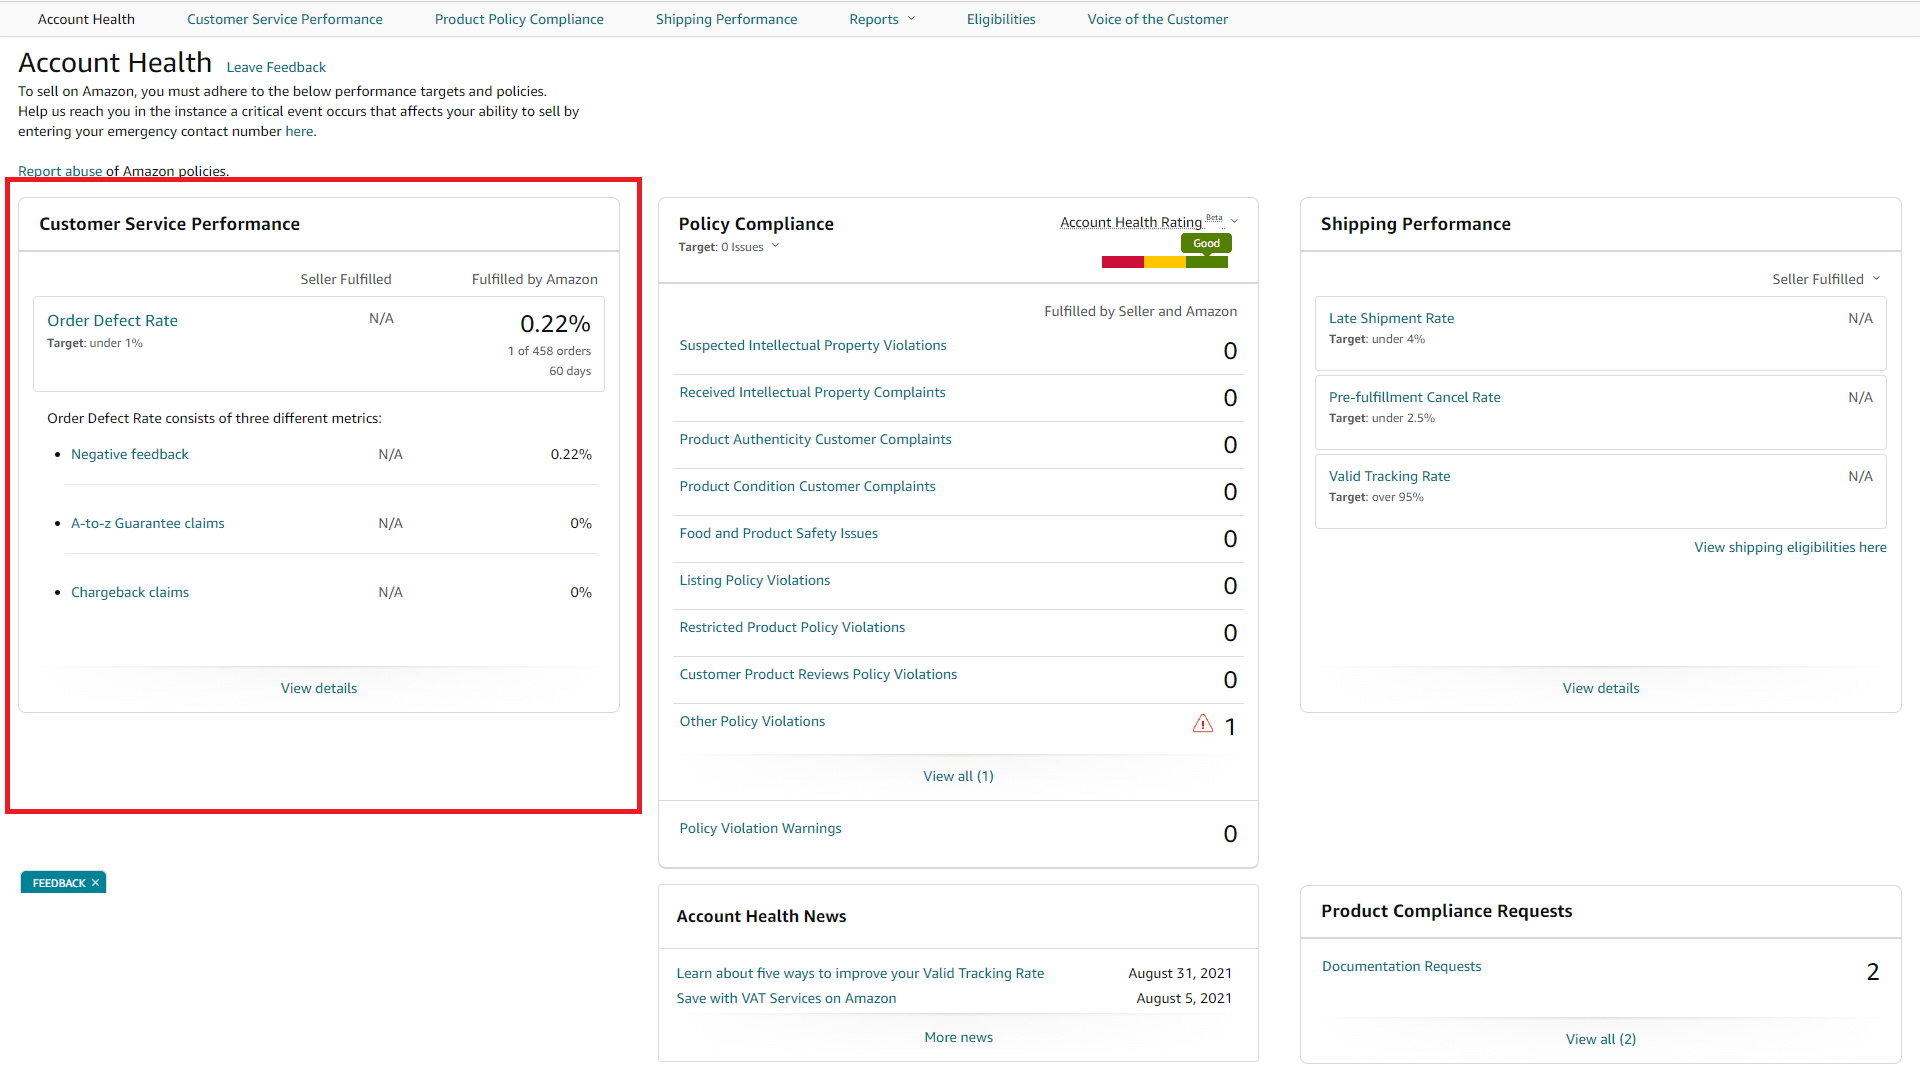
Order defect rate (ODR) is factored into your Account Health to represent the percentage of orders that get negative customer feedback. Your ODR shows up through Performance > Account Health. This value is based on three things:
- Negative feedback
- A-to-Z guarantee claims
- Chargeback claims
By Amazon standards, a good order defect rate is anywhere under 1%, anything beyond that threshold and you can kiss the Buy Box goodbye.
Another potential consequence is that Amazon might suspend or even terminate your account, not only because a high ODR affects their reputation, but they’ve also taken the responsibility of refunding customers.
Related Reading: How to Appeal Amazon Related Account Suspensions
After knowing your ODR, you can then prioritize which issues to address by zeroing in on those issues that pop up the most.
ODR issues are also best addressed by streamlining your shipping process, which largely means offering Prime shipping if you’re not already doing the usual FBA + Prime solution.
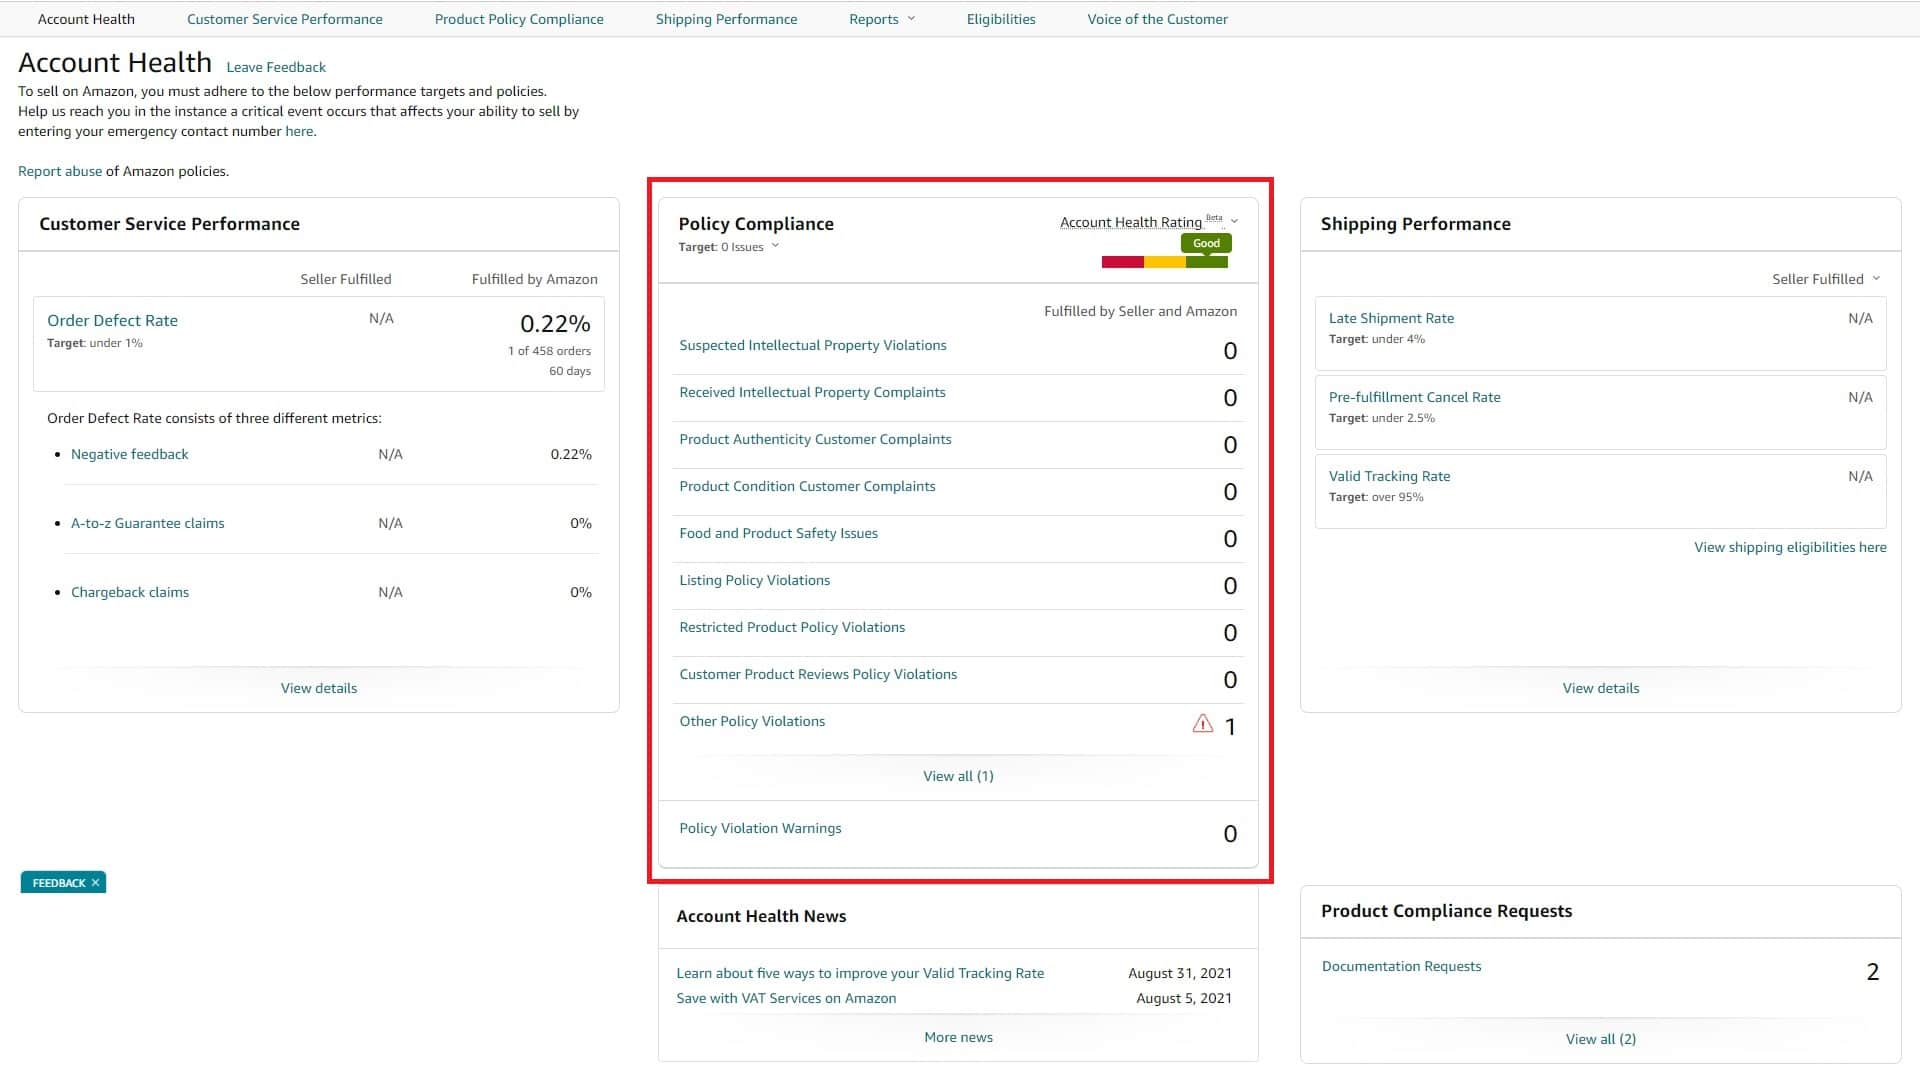
IP Complaints
Right next to the Customer Service Performance summary is a summary of your Policy Compliance, within which you can see how many intellectual property violations are currently affecting your account.
These violations are critical because they may result in content removal or even total account deactivation.
Product Reviews
Social proof is one of the biggest factors in online buying behavior, which is why keeping track of your product reviews is a big no-brainer.
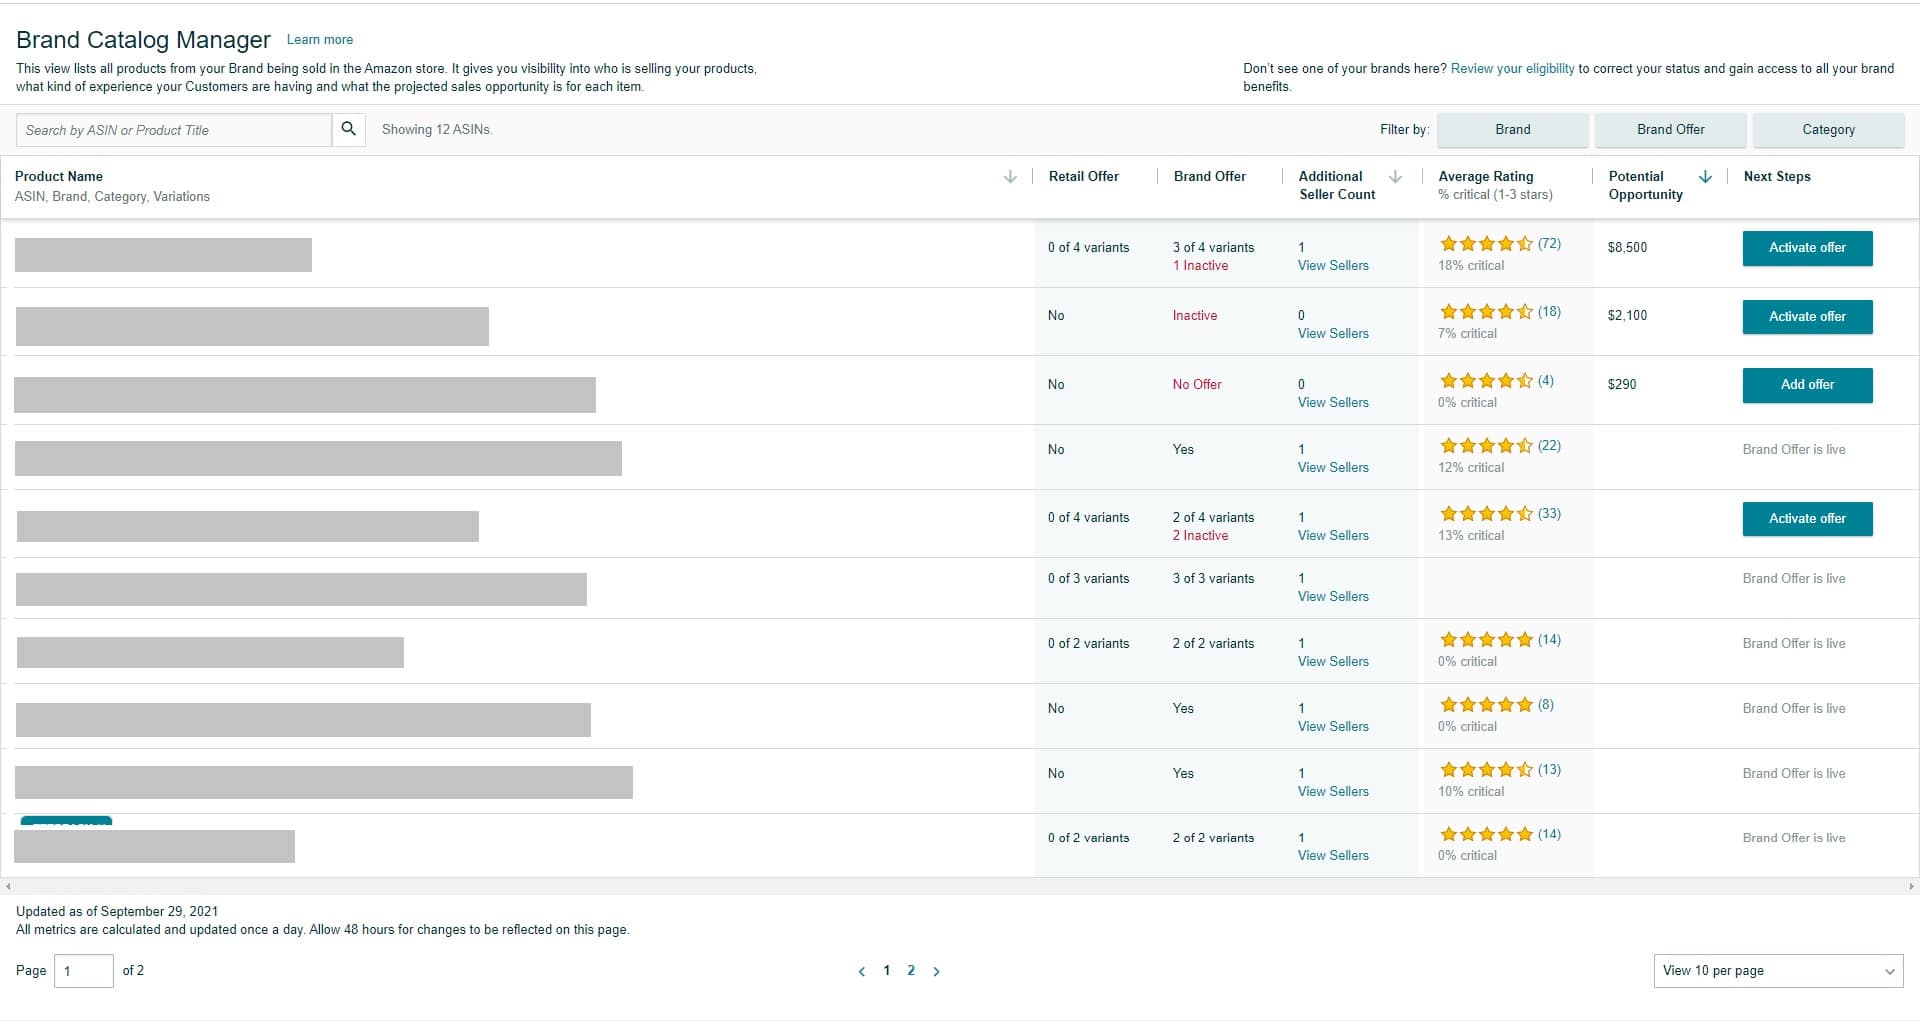
The easiest way to get an overview of all of your product reviews is to use the newly introduced Brand Catalog manager. If you want to check an individual ASIN, the easiest way of course is to navigate to the product detail page for that particular ASIN. Using software to track your historical rating of products (we use Helium 10) is useful as well.
Of course, keeping track of product reviews implies that customers actually left a review in the first place. Our Ultimate Guide to Getting Amazon Product Reviews lists some of the most effective ways to get your costumes to leave those juicy 5-star ratings.
Seller Feedback
You can view this metric through the Feedback Manager feature (Performance > Feedback). This will give you a glimpse of overall customer satisfaction in terms of average star rating over a certain period of time.
Seller Feedback is particularly important for resellers selling competing items, as great seller feedback (a range of 95-99%) will generally secure you the Buy Box and lead to more sales. Conversely, a negative feedback rate of over 25% could jeopardize your entire Account Health as opposed to just individual product health and even puts you at risk of account suspension.
This metric has to do with things like the quality of your packaging, how fast the product was shipped out and received, and how good your customer service is. Since it reflects your customer’s overall satisfaction as a
For the most part, it’s easy to have negative Seller Feedback removed, especially if the review talks more about the product than the seller. Factors obscene language and promotional content will also make it easier to have these negative reviews taken off.
Seller Feedback vs Product Reviews
These two metrics are vastly different from each other, but some sellers and customers tend to refer to them interchangeably.
Product Reviews are found on product detail page and deal with overall customer satisfaction of your individual products. It influences product ranking and serves as social proof for the products you sell.
Seller Feedback reflects your customer service and professionalism as a seller. It takes into account the quality of packaging, shipping, and handling, and is a key metric for sellers who are constantly battling for the Buy Box.
Inventory Performance Index (IPI)
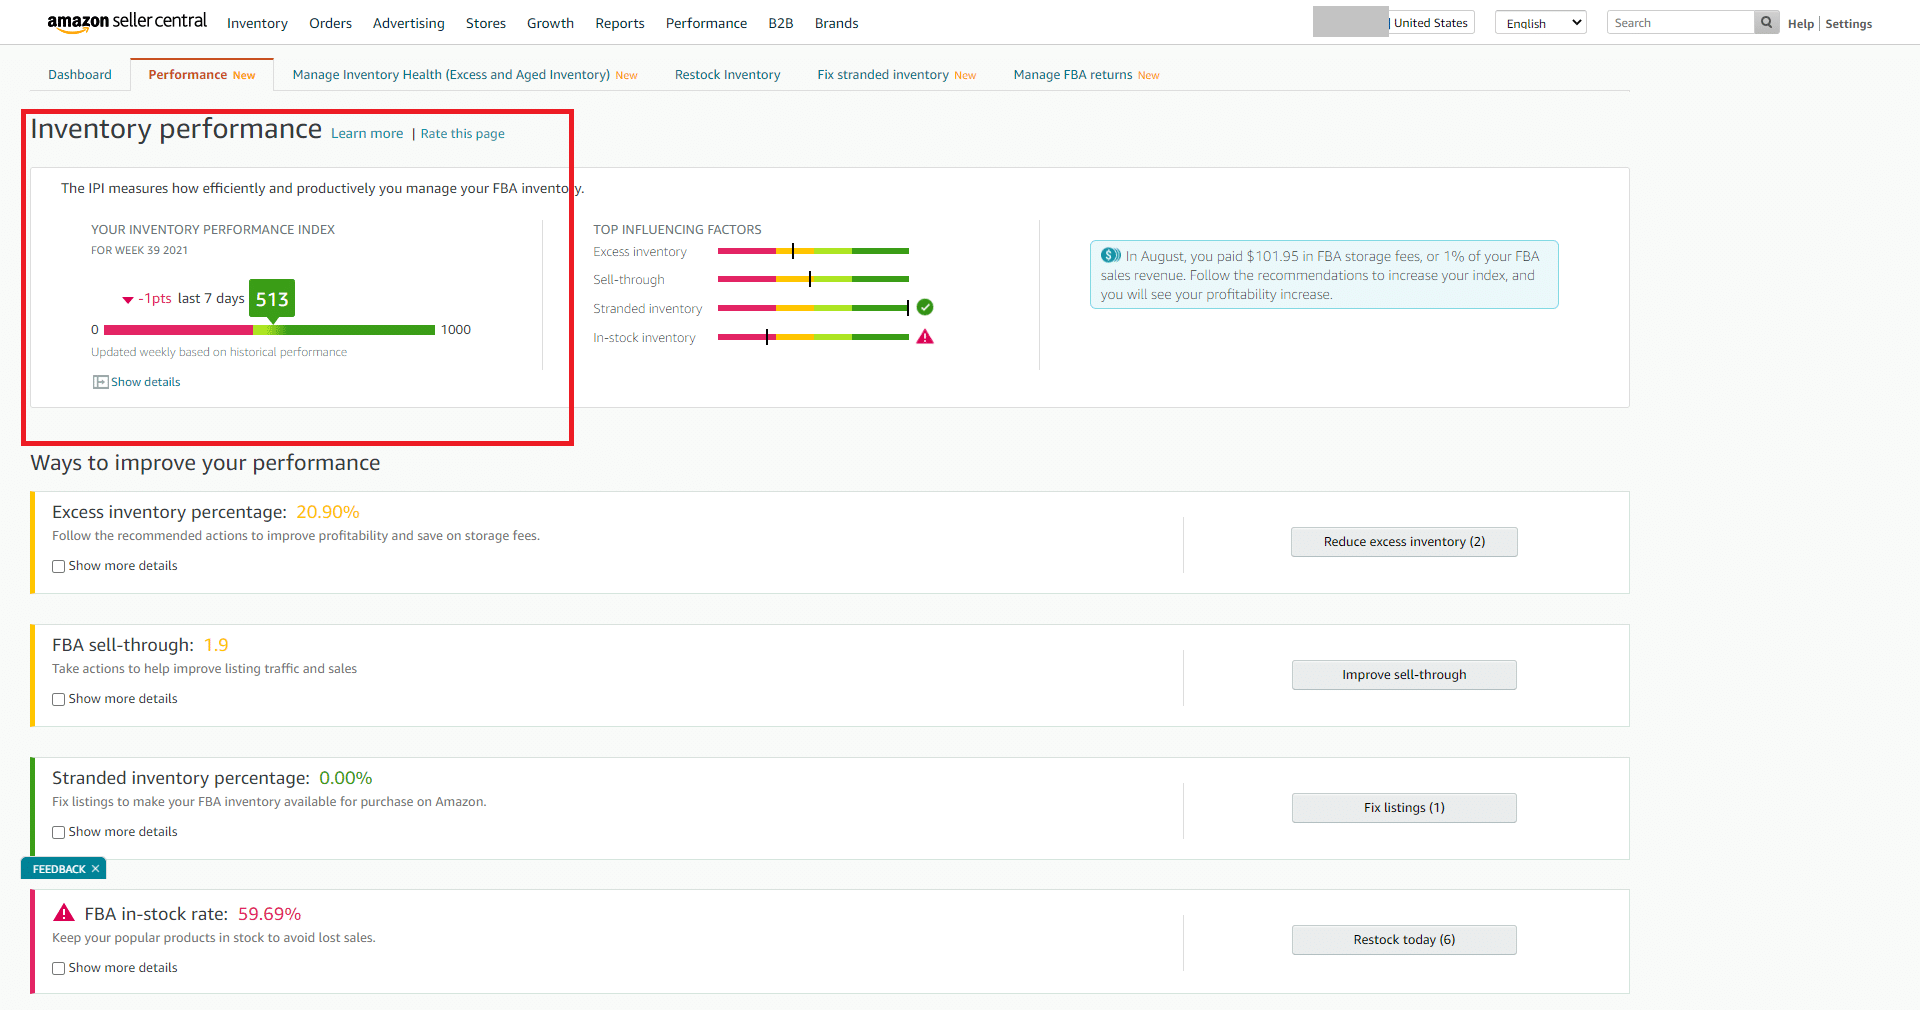
Inventory Performance Index or IPI is a number between 0-1000 that tells Amazon and you as a seller how well you are managing the inventory that you are storing inside its warehouses. To see your IPI, go to the Inventory Performance Dashboard on Seller Central.
The higher your IPI is, the better you are managing inventory in Amazon’s eyes. On the flip side, a low IPI puts you at risk of storage limitations.
Staying on top of your IPI will force you to avoid out-of-stock situations and will improve how efficient you are with your inventory. That means that you won’t put your keyword rankings at risk and you can even capitalize on your competitors’ own stockouts.
Even though the actual formula for this has not been disclosed (This is typical for most Amazon metrics, sadly), there are certain factors that have been shown to influence the IPI:
- Excess inventory
- Sell-through rate
- Stranded inventory
- In-stock inventory
These factors are updated daily in order to provide an accurate snapshot of your current inventory performance.
Ultimately what you want to do is look at your IPI score now and make sure you have an IPI score above the minimum threshold (currently, that would be between 400 and 500) either at the quarter’s end of 6 weeks prior.
Sometimes it can be reasonable to use 3PLs for storage and increase the frequency of sending inbound shipments into Amazon. You’ll also want to maintain 30 to 60 days of stock.

Brand Dashboard
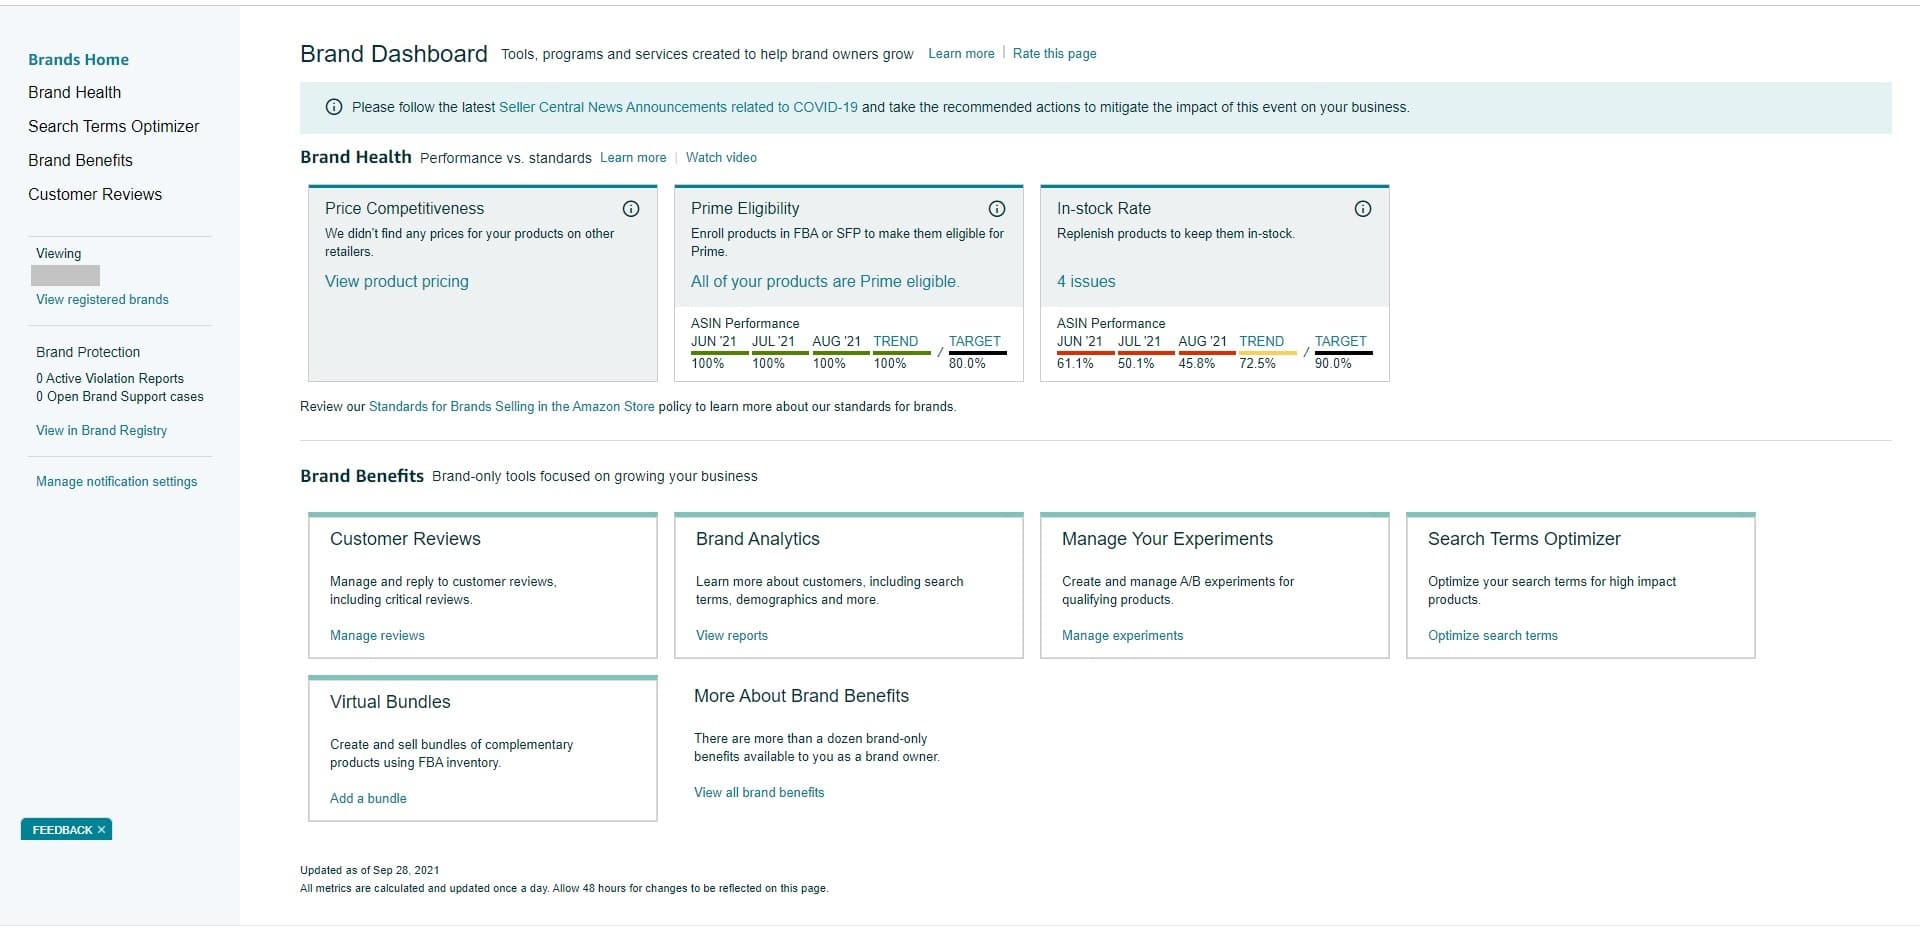
As the name suggests, the Brand Dashboard is a tool available to brands (ergo, you must be enrolled in Brand Registry) that shows your compliance with customer experience standards when selling on Amazon.
To access this interface, go to Performance > Brand Dashboard or use the link: sellercentral.amazon.com/brands/dashboard.
The two main sections you want to focus on are Brand Health and Customer Reviews.
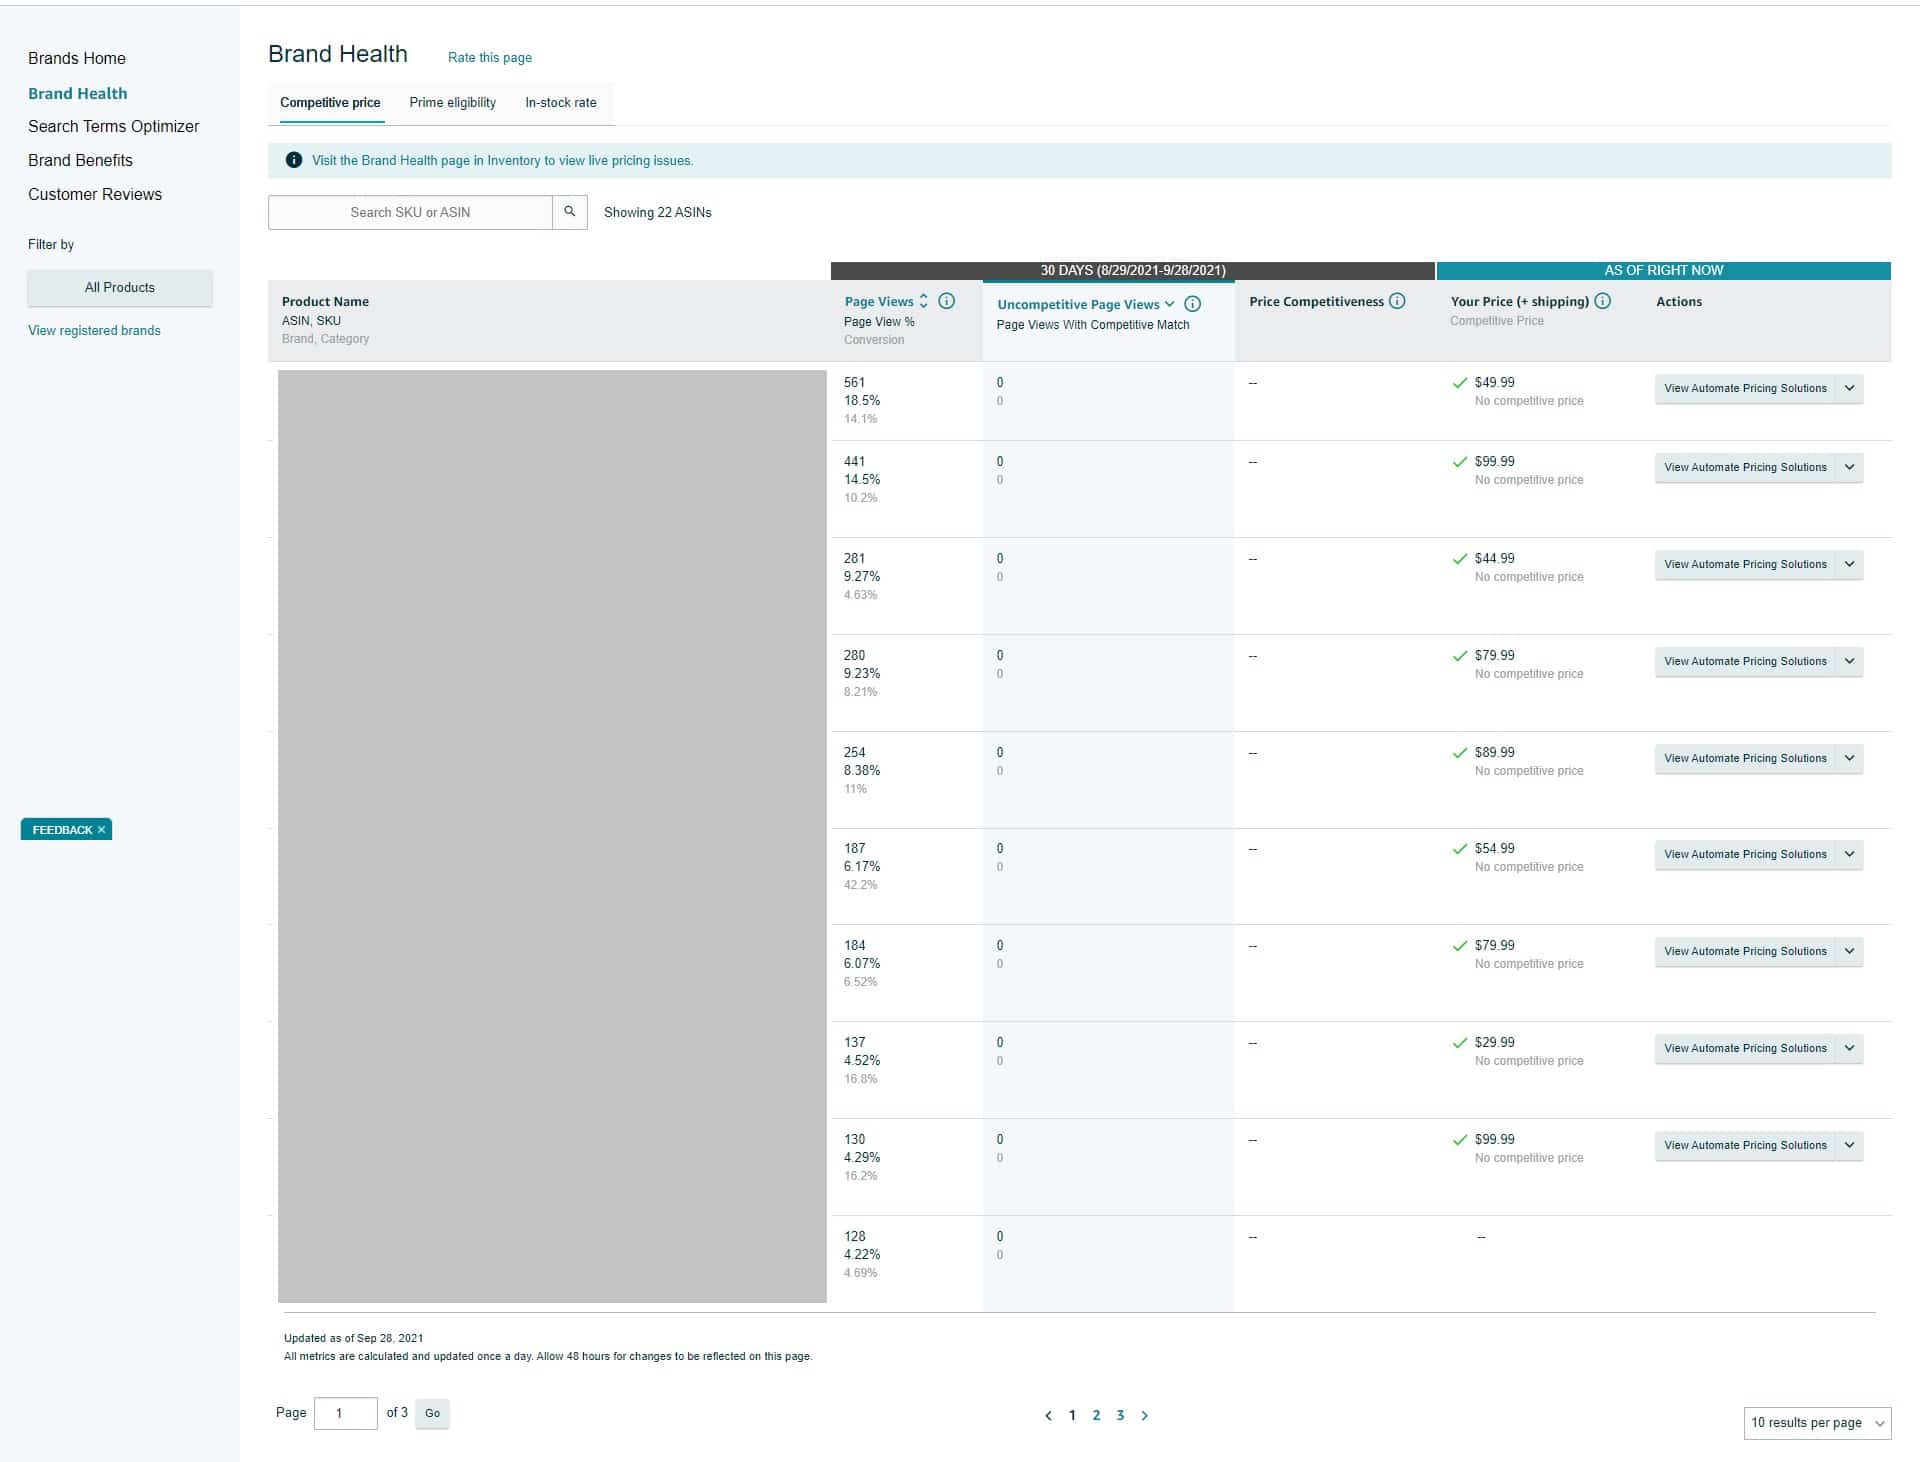
Brand Health is measured using three things:
- Competitive Price. This is how your own pricing compares to other major national retailers (not including the prices of other sellers on Amazon).
- Prime Eligibility. This is measured using the portion of page views on your brand that was not eligible for Prime over the trailing 30 days.
- In-stock Rate. This is measured by the portion of page views on your replenishable branded products that were in-stock over the trailing 30 days–this is distinct from FBA In-stock rate, which covers only inventory in FBA.
A good rule of thumb is to monitor your brand health monthly and make sure you comply with the customer experience standards. Failing to do so might mean losing some seller privileges like being eligible for the Featured Offer placement.
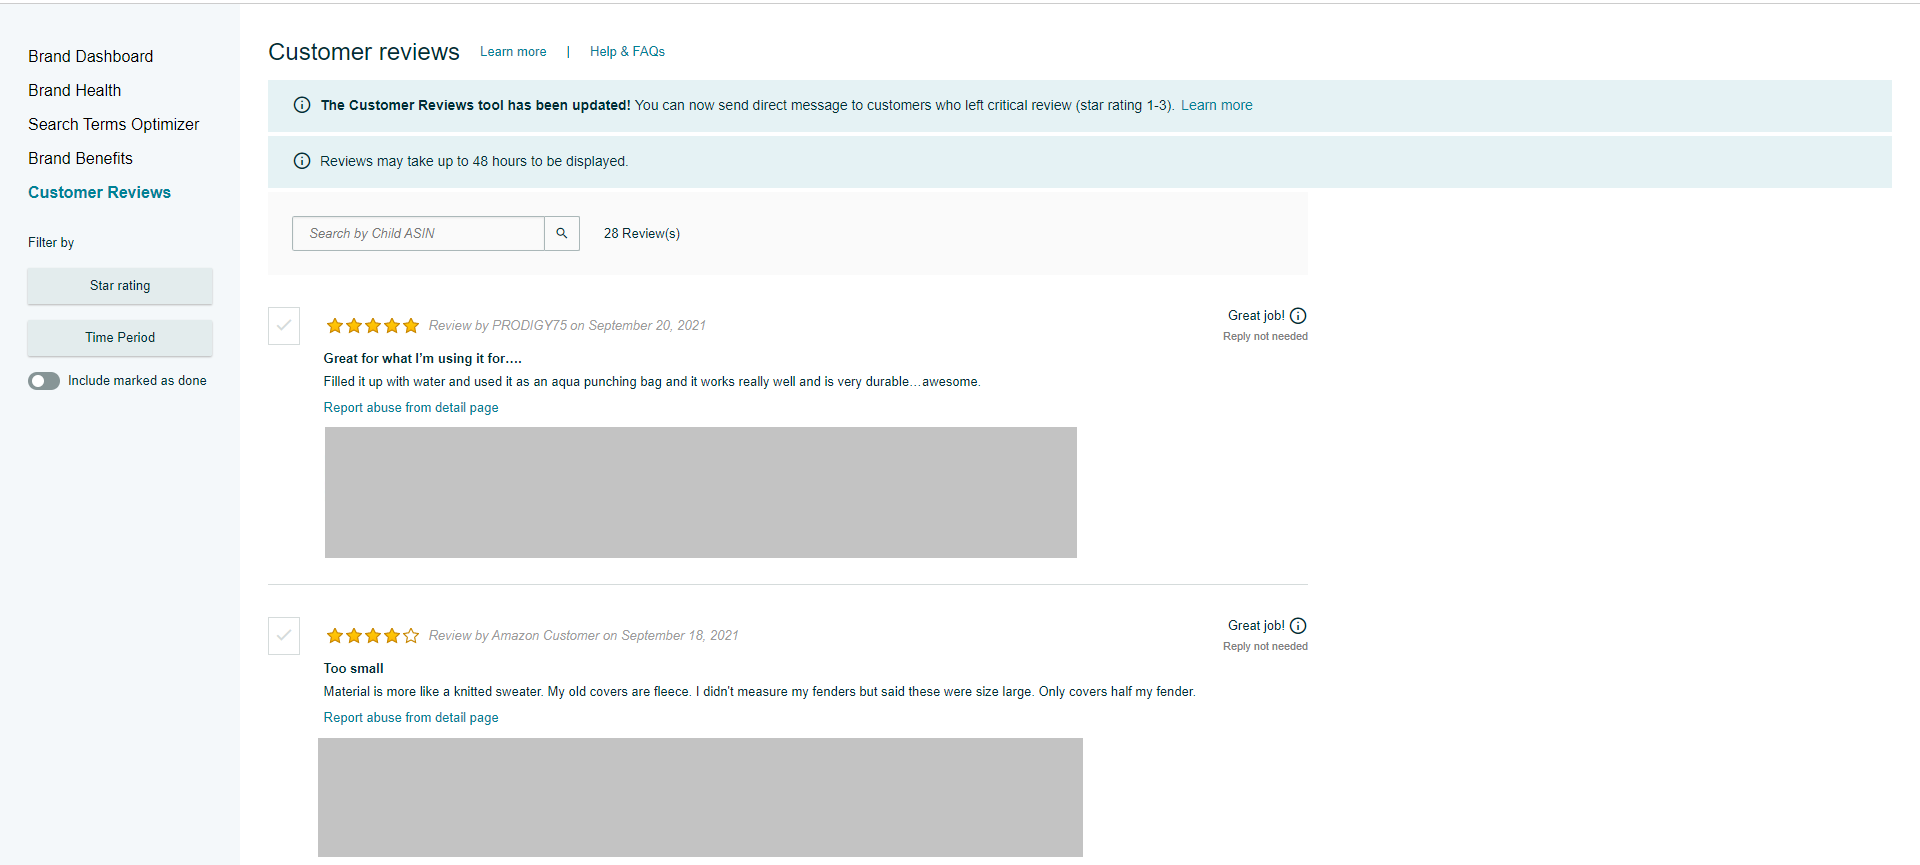
As for Customer Reviews, this section shows you a list of the reviews left by your customers from newest to oldest, which you can sort by Star Rating and Time Period.
Here, you can also comment on reviews and report ones that do not meet Amazon’s customer review guidelines. Also, at the time of writing, Amazon now allows you to directly contact customers who left critical reviews–star ratings of 1-3.
Brand Catalog Manager
A relatively new feature available only to brand-registered sellers on Amazon, this is a quick way to see all products under your catalog being sold on the platform by all sellers.
This feature also calculates the potential opportunity based on the aggregated past performance of multiple similar products. This will help you identify which products to double down on based on what’s popular among Amazon customers.
You can check out this feature by going to Brands > Brand Catalog Manager. If you don’t see this option, that means Amazon does not consider your brand to pass the criteria, in which case you may contact Brand Registry Support to request them to change this.
The page will show:
- Retail Offer. A Yes/No field that indicates whether you are currently sourcing the product via a Vendor relationship.
- Brand Offer. “Yes” means you have an active offer on the product. “Inactive” indicates that you have an offer on the product, but that it is either out-of-stock or inactive for another reason. “No” means that there is no offer from your Brand.
- Current Featured Offer. This Indicates which sellers is currently featured on the Product Detail Page.
- Additional Seller Count. This shows how many other sellers are currently listing the product in “new condition”.
- Average Customer Rating. The average Customer rating as it appears on the Product Detail Page.
- Potential Opportunity. This is a value that tries to estimate expected product sales over a 12-month period.
- Next Steps. Allows you to add an offer when one does not exist and to activate any inactive offers.
Conclusion
Dealing with various metrics and analyzing them is essential to growing an ecommerce business. If you stay on top of these critical metrics, chances are you’re on the right track.
How are you managing these critical seller metrics? Let me know in the comments down below.
